Derivatives Technology as a Matter of Survival
How can banks survive the upcoming years? The traditional business model no longer works, because:
1. Low/Negative Interest Rates: Interest rates in many major currencies (EUR, CHF, JPY in particular) are low or even negative. This causes lower bid-offer spreads in rates markets, because the bid side is bounded by a natural constraint, which is keeping cash.
2. Investor Greed/Commitment: Investors are looking for higher yield products, which the current market does not offer unless the investor takes up additional risks.
3. Platform dictatorship: Transaction banking and simple spot and forward transactions are taken over by highly competitive platforms. As in social media, platforms are going to dominate financial transaction business or are already dominating. Margins are coming down.
4. Non-regulated Regulators: Regulatory authorities glorify themselves and demand very cost-intensive compliance. A transaction that required 1 staff member in a bank in the last decade now requires 3-4 staff members. Doing business is strongly discouraged. Nobody checks or limits the self-glorification of regulators.
Solutions:
One of the solutions is electronic banking of derivatives or investment products containing derivatives. Derivatives and structured products that already generated higher margins since the 1980s are now made a commodity and traded electronically. This means there is a platform that is run by a hardware and/or software, which calculates a tradable bid and offers price of an investment product.
A product example: simple Dual Currency Investment (DCI): The investor deposits 1,000 EUR for 6 months, received an enhanced coupon of 5% p.a. above the money market par interest rate, but the issuing bank reserves the right to pay back the investment notional either as 1,000 EUR or 1,100 USD. Obviously the bank will always return the currency that is worth less at maturity of the investment.
From the investor’s point of view, the DCI comprises a 6-month deposit of the investment notional and a short vanilla call on the investment amount with 6 month maturity, strike 1.1000, which is the ratio of the notional amounts in both the currencies, with a premium deferred to maturity, so it feels like a coupon.
From the vendor’s point of view, the trading platform must provide live bid and offer prices of deposits and vanilla options. The challenges: The FX Options market is predominantly an OTC market, dominated by a small number of market makers including UBS, Deutsche, Citi, Barclays, JP Morgan, BNP, Standard Chartered, HSBC, Credit Suisse. Calculating the mid price (and consequently bid and offer price) of an FX Option uses the Black-Scholes formula and requires the implied volatility as the crucial input parameter. In fact, we need to know the matrix or surface of volatilities for all maturities and strikes, but only very few volatilities for standard tenors and 3-5 strike-equivalent delta levels are observable. The market makers push their own volatility surface, so won’t face this problem. All non-market making banks will have to interpolate and extrapolate volatilities for the options they want to trade through a calculation engine. Building such an engine requires the expertise of a quantitative team close to the market.

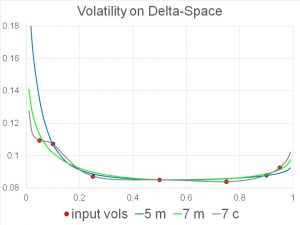
The graph shows implied volatilities for a 6-months EUR call USD put option. The delta of the option ranges from 0 to 1 on the x-axis. The unit on the y-axis is implied volatility in %. The input available from financial market data providers is at most the discrete set of seven points, but typically even fewer points. We show three curves that interpolate between the points and extrapolate outside the points. All curves are reasonable from a mathematical point of view: they contain the points either exactly or are fitted to the points in a best possible way, while still preserving smoothness and no-arbitrage conditions. Which of the curves is “the right one” is something we can only tell by mathematical analysis as well as trading experience. Sometimes it is more important that the curve contains all the points (the gray one, using an interpolation based on cubic splines), and in other circumstances it is more important that the curve doesn’t have any waves (the green or the blue one).
The curve construction is crucial, especially on the boundaries. Generally it is a well-known fact that, the higher the volatility, the higher the price of an option. Since the curves can be quite different, choosing the wrong curve leads to the wrong price: a vendor who offers the options on an electronic trading platform will either quote the price too high, in which case he won’t find any buyers, looses business and eventually disappears; or the price will be way too low, in which case he might get hit by a hedge fund that is just looking for such arbitrage opportunities. Even market making banks do get hit by hedge funds if their volatility surfaces are not up-to-the mark.
We can say more: the level of the curve drives the price of vanilla options, and the slope of the curve drives the price of digital options. Digital options are often used as building blocks for structured products. Looking at the very left point of the graph, the three curves have different slopes: the gray one has a slope of zero, the green one a negative slope, the blue one even a strongly negative slope.
Pricing digital options or more generally other exotic options depends on the slope and the convexity of the volatility curve. We may recall our high school knowledge of calculus: the first derivative f’(x) represents the slope and the second derivative f”(x) represents the degree of convexity. This is why we can’t just simply connect the points with lines. Connecting the points with lines will generate different slopes at the points, one coming from the left, another one coming from the right, which would cause a highly undesirable P&L shift in the derivatives portfolio. Any kink in the curve yields an exploding convexity and can cause “butterfly arbitrage” or negative probability densities, which means that the exotic derivatives trading platform crashes. It may take days to fix it, a time during which a bank would not see its current position and hedge parameters, leave alone the embarrassment.
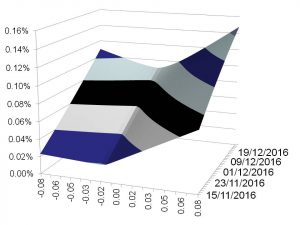
Interpolation actually goes further: once we have curves as above constructed for a given set of tenors, say 1 Month, 3 Months, 6 Months, 1 Year, 2 Years, we then need to interpolate for maturities in between and extrapolate for maturities before the first tenor and after the last tenor. On the time interpolation we need to ensure to avoid “calendar arbitrage” or negative forward variances as the mathematician would say. Once everything is done we will have a 3-dimensional surface of volatilities for all strikes and all maturities that is free of arbitrage, sufficiently rich and sufficiently smooth, and prices tradable/observable market instruments correctly. An example is shown in the following graph.

Besides the quantitative challenges, the volume traded of an options platform is also expected to be high. This requires fast calculations of all prices, hedge parameters and risk reports. Also, the issues of collecting, administering and distributing the required market input data requires a solid IT infrastructure. Essentially it requires a Financial Market Data Platform, with entitlement (who is allowed to see which data, who is entitled to change settings, upload volatilities, etc.), performance monitoring, logging (who did what under which permission).
The future will be dominated by those market players who have the best platforms. Platforms dictate our daily life already in many other areas. FX Options is to follow.
Uwe Wystup, Managing Director of MathFinance
